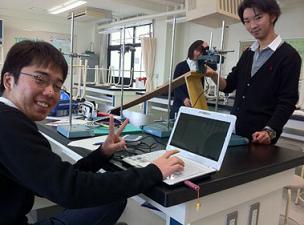
Today in Physics we used our new automation technology for the first time. In an experiment to examine the behavior of a ball as it rolls down a slope, students in IB1 were able to use a motion sensor to plot the position of the ball every 0.01 seconds and send the information back to the computer to be manipulated in a spreadsheet.
Students are ultimately aiming to verify Newton's Second law of motion by comparing graphs of their data to theoretical data generated by using formulae on the spreadsheet.
All IB students must use some automation in Science and it allows us to take data either over a very short period of time or consistently record data over days at a time. We will use automation for light intensity analysis, wavelength measurements, gas pressure changes, even ph variation in river water over the next two years as part of their 60 lab hours per subject.
Automation does not replace knowledge and understanding or the practical skill. Students must still design their own practical work, order equipment and carry it out. However it does allow them to collect vast quantities of data quickly which they can then analyse and draw conclusions from. Today students in 1 hour collected 5000 data sets which they will analyse, process, using 5 separate equations to get data, with uncertainties that they can plot on a graph. That's an average of 1.5 pieces of data per second.
 ******************************************************************************
今日の物理の授業では初めて新しいオートメーション技術を使いました。
坂を転がり落ちるボールの動きを調べる実験で、IB1の生徒はモーションセンサー(加速度センサー)を使い0.01秒ごとのボールの位置を記し、その情報を表計算ソフトで処理するためにコンピュータに送信することができました。
生徒は、自分たちのデータのグラフと表計算ソフトの公式を使って作りだした理論的なデータのグラフを比較して、最終的にニュートン第2法則(運動方程式)の検証を目指しています。
全てのIBの生徒は理科の学習において何らかのオートメーションを使わなければなりませんが、オートメーションによってとても短い時間でデータを得ること、もしくは一度に数日間かけて継続的にデータの記録をすることができます。
私たちはこれから2年間に渡って、教科ごとに行われる60時間の実習の一環として、光度分析、波長測定、ガス気圧変化、そして河川水のpHの変動に対しオートメーションを使う予定です。
オートメーションは知識や理解、実用技術に取って代わるものではありません。生徒は自分たちで実習を組み立て、道具を注文し、実行しなければなりません。
しかし、オートメーションによって分析をし、結論を出すための膨大な量のデータを素早く集めることができます。
今日、生徒は5つの異なる方程式を使って、グラフに書ききれるのかという不安と共に、これから分析、処理することになる5000のデータセットを1時間で集めました。
つまり平均で1秒間に1.5個のデータを集めたことになります。